Run Ansible playbooks
AWX/AAP and git-sourced catalogs coexist; cron schedules ride the same launch pipeline, all against devices in your live inventory.
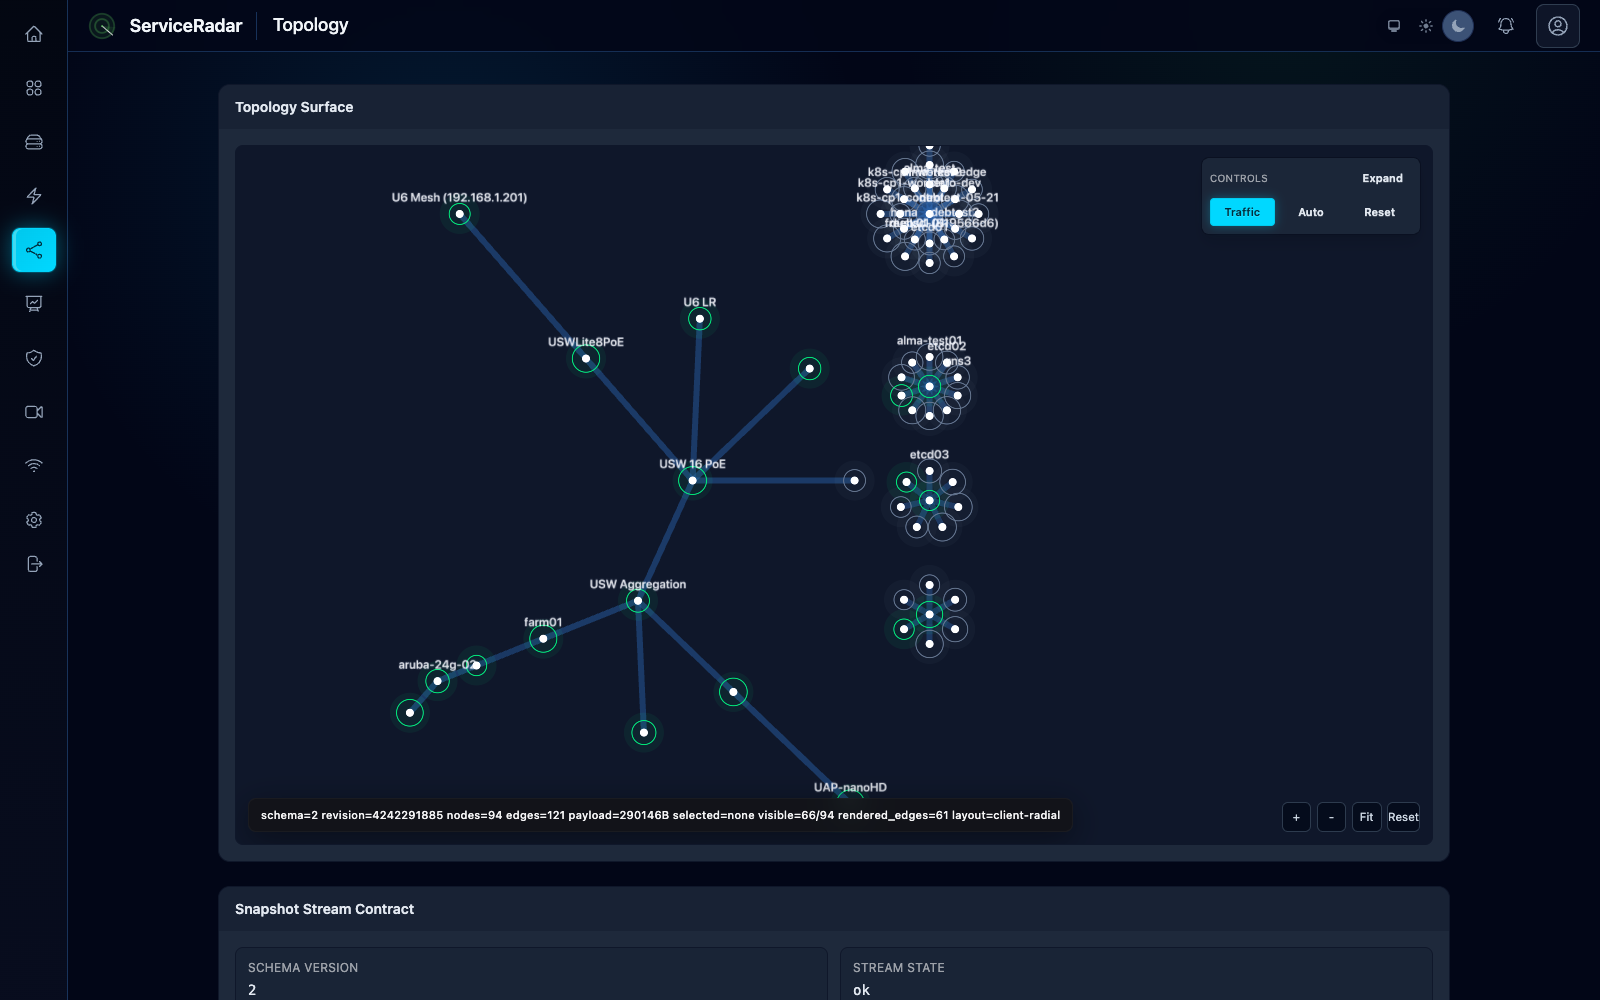
IT operations management is more than dashboards. ServiceRadar connects telemetry, incidents, inventory, and change, then lets you act, running Ansible playbooks against your live inventory and feeding everything to the causal engine for automated response.
Demo login:
demo@localhost
·
serviceradar
Run Ansible AWX/AAP and git-sourced playbooks against devices in your live inventory, on demand or on a schedule, with live per-host run telemetry projected to OCSF in the universal log viewer.
AWX/AAP and git-sourced catalogs coexist; cron schedules ride the same launch pipeline, all against devices in your live inventory.
Watch each playbook run host by host, normalized to OCSF so it lands in the same universal log viewer as everything else.
Time-series, relational, and graph topology data on one foundation, all reachable through a single query language, SRQL.
Build data-driven React dashboards with the Dashboard SDK that run inside ServiceRadar on live, SRQL-backed data.
Integrate ITSM, CMDB, IPAM, and SSO so incidents, inventory, and change context stay in sync across your tools.
The causal engine ties telemetry and change to a likely root cause and an automated response, not just another ticket.
Monitoring, management, security analytics, ITOM, and AI Ops run on the same open platform and the same data, with no point tools to stitch together.
We can't find the internet
Attempting to reconnect
Something went wrong!
Attempting to reconnect